



Technical debt governance isn't about eliminating all debt. That's like saying a business should never take a loan or use a credit line. The real question is whether you're managing debt strategically or just reacting when systems break.
Most teams handle technical debt the same way a restaurant owner handles equipment maintenance—they wait until the freezer dies during Saturday dinner rush. Then they scramble, overpay for emergency fixes, and promise themselves they'll be more proactive next time. They never are.
The teams that actually stay ahead don't have less technical debt than everyone else. They have better debt governance. They treat it like a financial portfolio: measured, scored, budgeted, and actively managed rather than discovered mid-crisis.
Why technical debt becomes ungovernable
Debt governance breaks down for predictable reasons. Teams start with good intentions—maybe a debt register or quarterly cleanup sprints. Six months later, the register is outdated, sprints keep getting canceled for "urgent" features, and debt only gets addressed when something critical breaks.
The core problem is treating debt as a secondary concern rather than an operational metric. You wouldn't run a business without tracking cash flow, yet most teams run products without tracking debt flow. They accumulate faster than they pay down, with no visibility into the rate or the compounding effect.
A software consultancy I worked with discovered their debt was doubling roughly every eight months. Not because they were careless—they had decent coding standards, regular code reviews, the usual stuff. But every client project added shortcuts, every deadline created workarounds, and nobody tracked the cumulative effect. By the time anyone noticed, simple features were taking three times as long to implement because developers spent most of their time navigating around old debt.
The scariest part? They only found out because a senior developer spent a weekend digging through commit histories. Without that random investigation, they would've kept accumulating debt blindly until development ground to a halt.
Discovery mechanisms that actually work
Most technical debt discovery happens accidentally—a developer stumbles across messy code, a feature takes forever to modify, or something breaks in production. That's roughly equivalent to discovering termites when your deck collapses.
Stop losing track of your priorities.
Workyly helps you organize, assign, and track every task efficiently.
- Centralized task management
- Real-time collaboration
- Intelligent workflow automation
No credit card required
Effective discovery requires systematic exploration, not random encounters. The teams that manage debt well tend to rely on three discovery channels:
Automated detection catches structural debt before humans notice it. Code complexity metrics, dependency analysis, and test coverage gaps get flagged automatically. One startup I worked with used static analysis tools to generate a weekly "debt heat map" showing which parts of their codebase were getting harder to maintain. They caught problem areas while fixes were still manageable—like spotting roof damage before it becomes a leak.
Developer reporting captures experiential debt that tools miss. When a developer says "this took way longer than expected," that's a debt signal. Smart teams make this systematic—they add a simple question to their task tracking: "Did technical issues slow this down?" with a 1-5 scale. Anything above 3 triggers a debt ticket. This catches the death-by-a-thousand-cuts debt that automated tools miss entirely.
Incident analysis reveals operational debt. Every production issue has debt roots—maybe inadequate monitoring, missing tests, or architectural brittleness. Teams that excel at debt governance don't just fix incidents; they trace back to the debt that enabled them. A payment processor I worked with discovered that around 60% of their incidents traced to three specific areas of legacy code. That insight transformed their debt strategy from "fix everything eventually" to "fix these three things now."
Risk scoring that drives decisions
Not all debt is equal, yet most teams treat a messy variable name with the same urgency as a critical security vulnerability. Risk scoring transforms debt from an overwhelming list into a prioritized portfolio. The framework that consistently works combines three factors:
Business impact measures what happens if this debt causes failure. A bug in the checkout flow costs revenue immediately. A bug in the admin panel annoys internal users but doesn't stop sales. Score this 1-5 based on affected users and revenue impact.
Probability of activation estimates how likely this debt is to cause problems. Debt in frequently modified code activates often. Debt in stable, rarely-touched modules might never matter. Track how often each code area changes—if it's touched monthly, debt there is high-risk. If it hasn't changed in two years, it's probably safe to deprioritize.
Remediation complexity determines the effort required to fix it. Some debt takes an hour to clean up. Other debt requires architectural changes across multiple systems. Score this based on estimated developer days, not just coding time—include testing, deployment, and monitoring.
Multiply these scores: Risk = Impact × Probability × Complexity. This gives you a number between 1 and 125.
| Score Range | Priority Level | Action |
|---|---|---|
| Above 50 | Critical | Immediate attention |
| 20–50 | High | Next sprint |
| Below 20 | Low | Backlog unless capacity allows |
A marketplace platform used this scoring to discover that 80% of their perceived debt scored below 20. They'd been stressing about hundreds of issues when only around 30 actually mattered. Focusing on those high-scored items reduced their incident rate by 65% over three months.
Prescriptive paydown sprints
Random debt cleanup doesn't work. I've watched teams declare "cleanup sprints" that devolve into developers fixing whatever personally annoys them. That's like letting each employee choose which bills to pay—you'll end up with a paid streaming subscription but an unpaid electric bill.
Prescriptive paydown sprints follow strict rules:
Sprint composition: Every paydown sprint targets a specific debt category. One sprint might focus on test coverage gaps. The next targets database query optimization. This focus prevents scattered effort and enables measurable outcomes. A fintech startup ran monthly themed sprints—January for security debt, February for performance debt, March for test debt. After a year, they'd systematically worked through every debt category instead of randomly patching issues.
Time allocation: Dedicate 20% of engineering capacity to debt paydown. Not 10% that gets cut when deadlines loom. Not 50% that stalls feature development. Twenty percent is sustainable—enough to make real progress without killing momentum. This might be one day per week or one week per month, but it's non-negotiable. Cancel features before canceling debt sprints.
Treat the 20% allocation as sacrosanct—protect it in planning and don't let feature pressure erode it.
Success criteria: Each sprint needs a quantifiable goal. "Improve code quality" is useless. "Reduce average query time from 400ms to 200ms" is measurable. "Increase test coverage from 45% to 70%" is achievable. Without specific targets, debt sprints become unfocused cleanup time.
Assignment rules: Debt owners aren't necessarily the original authors. Assign based on current expertise and system knowledge. The person who best understands the payment system fixes payment debt, regardless of who wrote it originally. This prevents the blame game and ensures fixes are done right.
Maintenance budgets and resource allocation
Technical debt needs a budget like any operational expense. Not a "we'll find time eventually" promise—actual allocated resources with spending rules.
Start with 20% of engineering capacity as your baseline debt budget. Adjust based on your debt/velocity ratio—if debt is growing faster than features ship, increase to 30%. If you're keeping pace, 20% holds steady. If you're actually reducing debt over time, you can drop to 15% temporarily.
This budget gets protected like payroll. You don't skip paying employees when cash is tight; you don't skip debt payment when deadlines are tight. One agency learned this painfully—they kept pulling from their debt budget for client projects. Six months later, their velocity had dropped 40% because every feature had to fight through layers of accumulated debt.
Budget allocation follows risk scores. The top 20% highest-risk items get 50% of the budget. The next 30% get 35%. The bottom 50% share the remaining 15%. This prevents the common mistake of fixing many easy issues while critical problems keep compounding.
Track spending carefully. Every hour spent on debt reduction gets logged against the budget. A SaaS company I know found they were actually spending 35% of their time on debt but calling it "feature development" because fixes were buried inside feature work. Proper tracking revealed the true cost and justified a larger official budget.
KPIs that trigger action
Most teams track metrics like code coverage or cyclomatic complexity, but these don't tell you when to act—they document problems after the fact. The KPIs that actually matter are the ones tied to behavior, not just documentation.
Velocity degradation rate measures how much slower features ship over time. Calculate average story points delivered per sprint, then track the trend. When velocity drops 15% over any three-month period, that's your trigger for a debt intervention. One team ignored a slow decline for a year—what started as an 8% drop became a 50% productivity loss.
Incident correlation score tracks what percentage of incidents trace back to known debt. When more than 30% of your incidents come from debt-heavy areas, you're past the safety threshold. A logistics platform discovered 70% of their outages came from three legacy services. They'd been treating symptoms while the disease spread.
Modification time ratio compares how long changes take in debt-heavy code versus clean code. When modifications in problematic areas take 2x longer than in clean areas, debt is actively hurting productivity. Track this by comparing story estimates to actual time, grouped by code area.
Debt discovery rate measures how fast new debt appears versus how fast you're paying it down. If you're discovering 20 debt items per month but only fixing 15, you're losing ground. This simple ratio predicts whether your situation improves or deteriorates over time.
Set explicit thresholds for each KPI. When velocity drops 15%, trigger a focused sprint. When incident correlation exceeds 30%, escalate to leadership. When modification ratio hits 2x, freeze features until you address the bottleneck. Without predetermined triggers, teams rationalize away warning signs until crisis hits.
Escalation and intervention protocols
KPI breaches need predetermined responses, not committee meetings. Like a kitchen fire—you don't convene a discussion, you grab the extinguisher.
Level 1 escalation (yellow flags):
-
Velocity drops 10-15%
-
Incident correlation reaches 20-30%
-
Modification ratio hits 1.5x
Response: Increase debt budget to 25% for next sprint. No meetings required, engineering lead makes the call.
Level 2 escalation (orange flags):
-
Velocity drops 15-25%
-
Incident correlation reaches 30-40%
-
Modification ratio hits 2x
Response: Freeze non-critical features for two weeks. Run focused debt sprint on highest-risk items. Product and engineering leads jointly approve.
Level 3 escalation (red flags):
-
Velocity drops over 25%
-
Incident correlation exceeds 40%
-
Modification ratio exceeds 2.5x
Response: Full stop on features. All engineering capacity goes to debt reduction until KPIs return to yellow zone. CEO-level decision required.
These protocols prevent the common pattern where teams acknowledge problems but keep shipping anyway. A mobile app company watched their velocity drop 30% over six months, holding meeting after meeting while continuing to push features. By the time they finally stopped, what could've been a two-week fix became a two-month reconstruction.
Building your debt governance system
Setting up technical debt governance doesn't require complex tools. Start with visibility, add measurement, then implement controls.
-
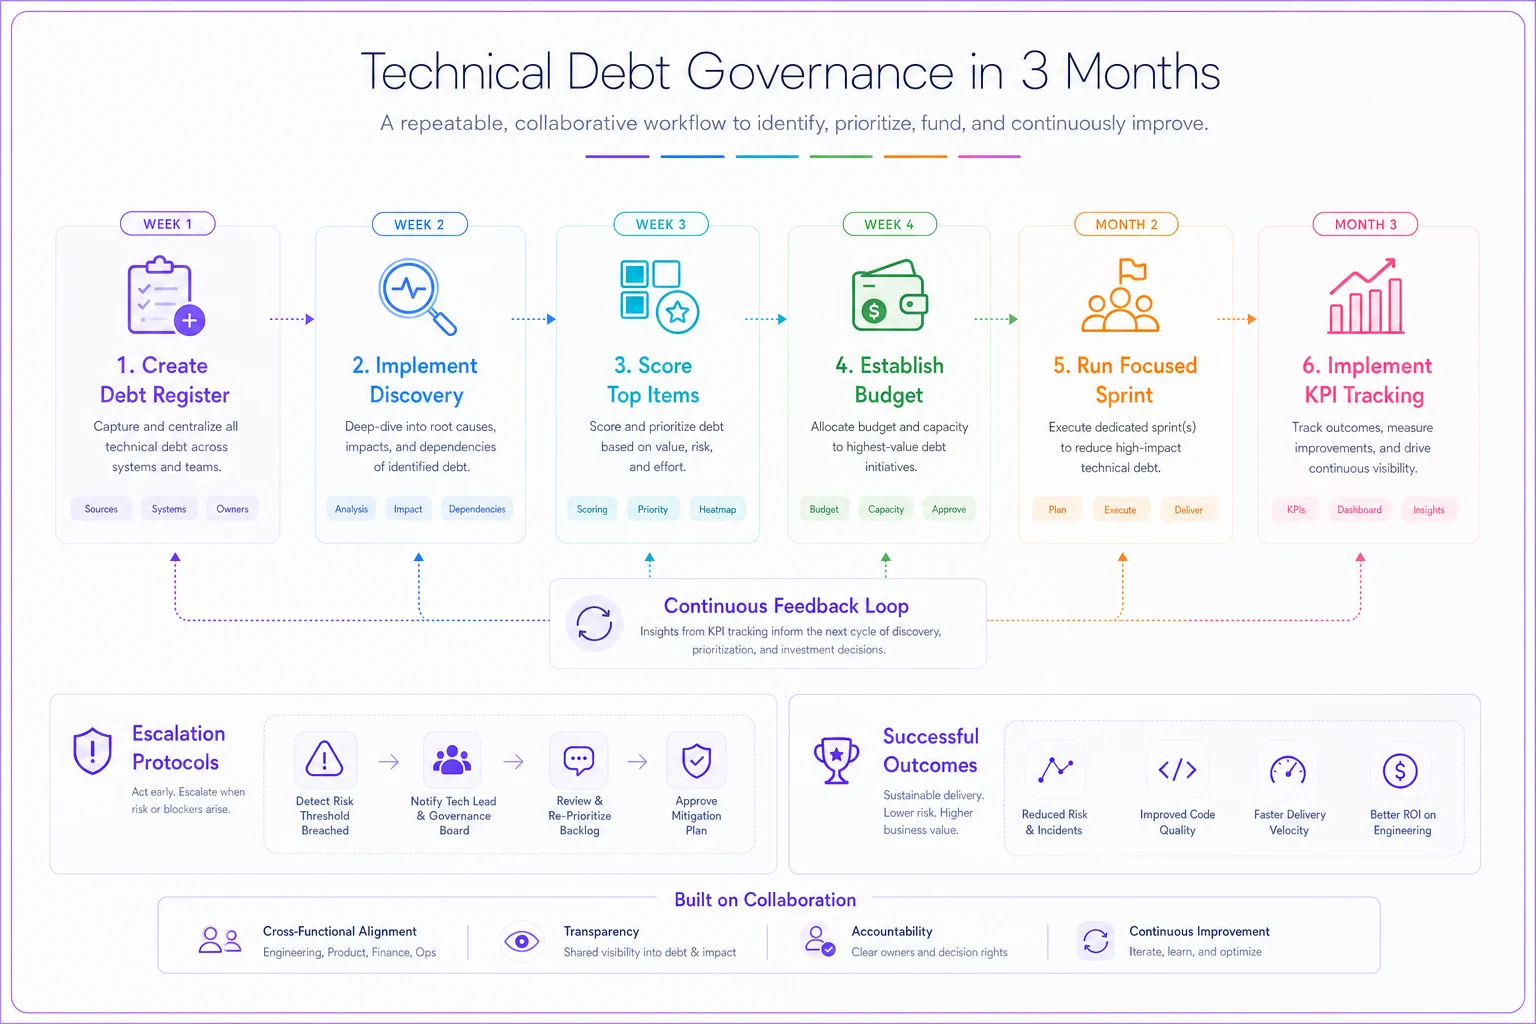
Week 1 Create your debt register. List known technical debt in a simple spreadsheet. Include description, affected area, and initial risk estimate. Don't overthink it—a rough list beats no list.
-
Week 2 Implement basic discovery. Add a "technical friction" field to your task tracking. Start logging which tasks take longer due to technical issues. Review delivery risk patterns to identify systemic problems early.
-
Week 3 Score your debt. Apply the Impact × Probability × Complexity formula to your top 20 items. Rough estimates are fine—precision comes later.
-
Week 4 Establish your budget. Allocate 20% of next month's capacity to debt reduction. Target your highest-scored items first. Connect this with your backlog cleanup process to prevent debt from hiding in aging tickets.
-
Month 2 Run your first focused sprint. Pick one category of debt. Set a measurable goal. Track actual time spent. Measure the outcome.
-
Month 3 Implement KPI tracking. Start with velocity degradation—it's easiest to measure. Add other KPIs as your system matures. Use lessons from restarting stalled initiatives when debt remediation efforts lose momentum.
This simple schedule maps to a repeatable workflow teams can follow to build governance rapidly.
The key is starting before you need it. Teams that wait for a crisis to implement debt governance never really escape crisis mode.
The portfolio perspective
Technical debt governance succeeds when you stop treating debt as a problem and start managing it as a portfolio. Some debt is strategic—like taking a loan to seize an opportunity. Some debt is operational—like using a credit card for cashflow. Some debt is toxic—compounding faster than you can ever pay it down.
Zero debt isn't the goal. Strategic debt that helps you move fast can be worthwhile if you have a payment plan. The disaster is accumulating debt blindly, without tracking costs or planning paydown.
A successful e-commerce platform operates with roughly 30-40 high-risk debt items at any given time. That sounds bad until you realize they also track 200+ low-risk items they consciously ignore. They know exactly what debt they carry, what it costs them, and when they plan to address it. Velocity stays consistent because debt never surprises them.
Modern operational software platforms now incorporate debt tracking directly into team workflows. AI-powered systems can automatically detect code complexity increases, track modification times, and predict which debt is likely to cause future problems based on change patterns. Instead of manual spreadsheet tracking, these platforms centralize debt discovery, scoring, and assignment in the same place teams manage regular work. The automation is most useful in the discovery and measurement phases—scanning codebases for complexity, analyzing change frequency, correlating incidents with specific code areas.
But automation only works when the governance structure already exists. You still need the budgets, the KPIs, the escalation protocols. AI can tell you that debt is accumulating faster than you're paying it down, but you still need to decide what to do about it.
Technical debt governance isn't about perfection. It's about conscious trade-offs, measured risks, and predictable outcomes. Start measuring your debt portfolio this week—not next quarter when things calm down, not after the big release. Because the only thing worse than carrying technical debt is carrying it blindly.
Ready to boost your team's productivity?
Join 5,000+ teams using Workyly to streamline workflows, improve communication, and deliver projects faster.