


Most teams don't have a metrics problem. They have a trust problem. The dashboards exist, the numbers are plotted, but when a leadership meeting hits a real decision point, someone always asks the question that stalls everything: "Wait, is that number actually right?" And nobody in the room can answer with confidence.
That question is the real cost of missing instrumentation governance. Operational metrics get used to justify funding, kill projects, staff up, and trigger rollbacks — but the plumbing underneath them is usually unowned, undocumented, and quietly drifting. This article is about building that plumbing: who owns each metric, how definitions are stored, what tests prove a number is still valid, and how every threshold and alert traces back to a real decision.
The failure isn't the metric — it's the space around it
Walk into almost any growing operation and you'll find the same pattern. Someone builds a metric because a VP asked for it. Six months later that person has moved teams. The metric is still on the dashboard. Nobody knows how it's calculated anymore, whether the source table still means what it meant, or who to ping when it breaks.
The metric itself looks fine. It's the governance layer around it that's gone — the ownership, the definition of record, the verification, the link to why anyone cared in the first place. In real operations, this usually surfaces at the worst possible moment: a funding review where two teams present the same metric with different numbers because they pulled from different tables with slightly different filters.
Metric quality degrades silently at scale. There's no error message when a metric quietly becomes wrong. It just keeps rendering a plausible-looking number, and people keep making decisions off it, until a big enough discrepancy forces a painful audit. By then you're not fixing one metric — you're re-deriving trust in the whole dashboard.
An unowned metric isn't neutral. It's actively dangerous, because it carries the authority of a metric without any of the accountability. People trust it precisely because it's on the dashboard.
Where metrics quietly rot as you scale
Small teams get away with informal metric handling because everyone shares the same context. Three people, one analyst, a common understanding of what "active user" means. That works until it doesn't.
Stop losing track of your priorities.
Workyly helps you organize, assign, and track every task efficiently.
- Centralized task management
- Real-time collaboration
- Intelligent workflow automation
No credit card required
-
One team, one analyst Definitions live in someone's head. Fine, mostly.
-
Multiple teams pulling the same concept "Churn" now means three different things depending on who you ask. Sales counts logo churn, finance counts revenue churn, product counts usage lapse. All correct, all conflicting.
-
Cross-team funding decisions Those conflicting definitions collide in a room where money moves. The meeting derails into definition arguments instead of actual decisions.
-
Automated triggers on top of metrics You wire alerts and rollback triggers to thresholds. Now a metric that silently drifted doesn't just mislead a human — it fires an automated action based on a broken input.
That last stage is where the absence of instrumentation governance stops being annoying and becomes expensive. When you've connected metrics to decision records that link to funding, monitoring and rollback triggers, a bad metric propagates into bad actions automatically. The blast radius grows with every automation you build on top.
A typical example: an ops team sets an alert threshold on "order fulfillment latency." A schema change upstream renames a timestamp column. The pipeline defaults the missing field to null, latency calculates as zero, and the alert never fires — for eleven days. Nobody notices because zero looks great. The metric was technically "working." The governance around it wasn't.
The five pieces of a real governance model
A workable model for instrumentation governance has five parts that reinforce each other. Skip one and the others leak.
1. Schema registry: the definition of record
This is the single source of truth for what each metric means, not just where it lives on a chart. Each entry captures the metric name, the precise calculation logic, the source tables and fields, the grain (per user? per order? per day?), and the version history.
The point isn't documentation for its own sake. The point is that when someone questions a number, there's one authoritative place to resolve the argument — and when a source table changes, you can immediately see every metric that depends on it.
The mistake people make: treating the registry as a wiki page that gets written once and abandoned. A registry only works if it's the thing dashboards and pipelines actually reference, not a parallel document that drifts from reality.
2. Metric owners: a name, not a team
Every metric needs one human owner. Not a team, not a Slack channel — a person. Teams diffuse accountability; individuals concentrate it. The owner is responsible for the definition, for approving changes, and for being the first responder when the metric behaves strangely.
Ownership should be visible on the metric itself. If you hover over a number on the dashboard, you should see who owns it and when it was last verified. Anonymous metrics are the ones that rot.
3. Verification tests: prove the number is still true
This is the part almost everyone skips, and it's probably the highest-leverage piece of the whole model. Verification tests are automated checks that assert a metric still behaves correctly:
-
Range tests conversion rate should never be above 100% or below 0%.
-
Freshness tests the underlying data updated within the expected window.
-
Volume tests row counts didn't suddenly drop 80% (a sign of a broken join or filter).
-
Reconciliation tests the metric ties out to an independent source within tolerance.
-
Null-rate tests the field that feeds this metric isn't suddenly full of nulls.
The fulfillment-latency example above fails silently because there was no volume or null-rate test. A single check — "why did every latency value become exactly zero?" — would have caught it on day one.
4. Alert thresholds tied to intent
Thresholds shouldn't be arbitrary lines someone eyeballed. Each threshold should record why it exists and what action it's meant to provoke. An alert with no attached response is just noise that trains people to ignore alerts.
Every threshold entry should answer: What decision or action does crossing this line trigger? Who gets notified? What's the expected response time? That's what separates a threshold from a decoration.
5. Audit trails linked to decisions and funding
The final piece closes the loop. When a metric changes definition, when a threshold moves, when an alert fires and drives an action — all of it gets logged and linked to the decision record and, where relevant, the funding action it influenced.
This matters because six months later someone will ask "why did we cut this project?" and the honest answer needs to be traceable to the metric state at the time, not reconstructed from memory. Tying instrumentation to decision records as operational artifacts is what makes metrics defensible rather than just persuasive.
How the pieces work together as a workflow
Here's roughly what this looks like end-to-end, when a new metric enters the system. The steps aren't glamorous but the sequence matters — skipping the early stages is how you end up with ungoverned metrics six months later.
Below is a compact workflow representation of the sequence for a metric from proposal to decision linkage.
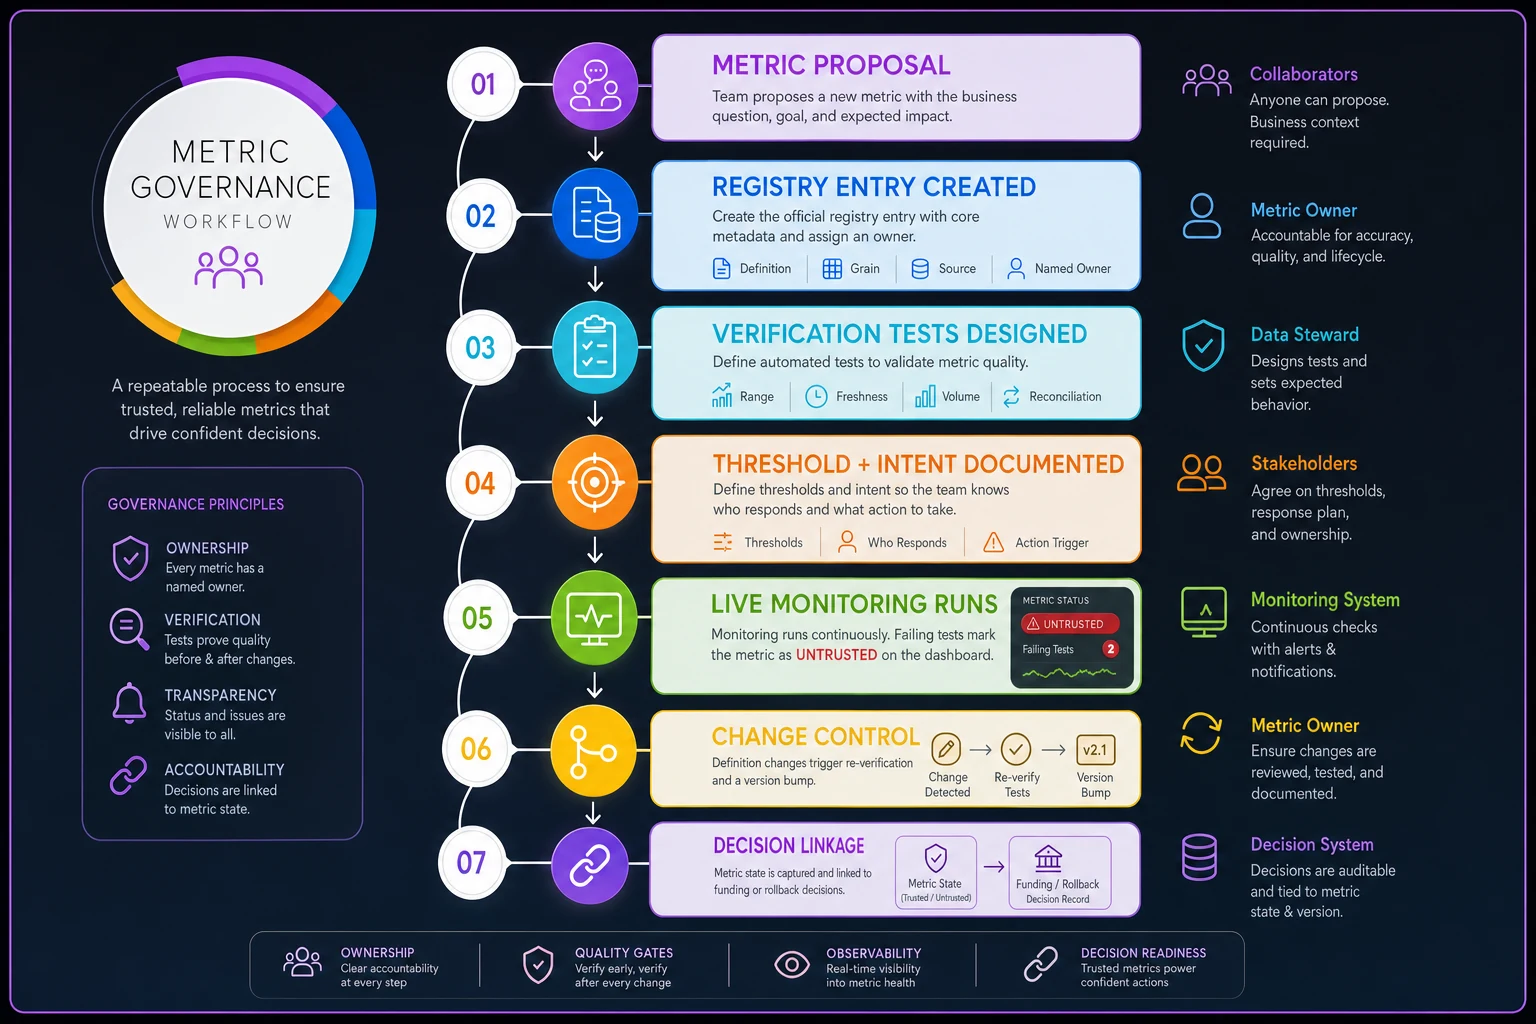
The numbered steps below describe the same sequence in text.
-
Proposal. Someone requests a metric. Before it's built, it gets a registry entry: definition, grain, source, and a named owner. No entry, no metric.
-
Verification design. The owner defines the tests that prove the metric is valid — range, freshness, volume, reconciliation. These ship with the metric, not as an afterthought.
-
Threshold + intent. If the metric drives alerts, each threshold records its intended action and response owner.
-
Live monitoring. Verification tests run on a schedule. A failing test flags the metric as untrusted on the dashboard — visibly, so nobody makes a call off a broken number.
-
Change control. Any change to definition or source triggers re-verification and a registry version bump. Downstream dependents get notified automatically.
-
Decision linkage. When the metric drives a funding or rollback decision, the audit trail captures the metric's exact state and links it to the decision record.
The whole point is to make the trust status of every number legible at the moment of decision. A number you can't verify shouldn't render as if it's fine.
Manual vs. governed instrumentation
The table below is blunt on purpose. The gap between the two columns isn't about sophistication — it's about whether you're paying the cost upfront or compounding it later.
| Dimension | Ad-hoc / manual | Governed instrumentation |
|---|---|---|
| Metric definition | In someone's head or a stale doc | Versioned entry in a schema registry |
| Ownership | Diffuse or unknown | One named owner, visible on the metric |
| Detecting breakage | Someone eventually notices | Verification tests flag it automatically |
| Threshold rationale | "Felt about right" | Recorded intent + response owner |
| Decision traceability | Reconstructed from memory | Audit trail linked to decision records |
| Blast radius of a bad metric | Grows silently | Contained and surfaced |
| Cost at scale | Rises sharply | Roughly flat |
The right column isn't more bureaucracy. It's front-loading a small amount of discipline so you don't pay the compounding cost of untrusted metrics later.
A real scenario
A mid-sized logistics operation — around 40 people, ops-heavy, running a handful of dashboards for a weekly funding-and-staffing review — kept hitting the same wall. Every review, at least one metric got disputed, and a good chunk of the meeting evaporated into arguing about whether numbers were right instead of deciding what to do.
The specific failure: two teams reported "on-time delivery rate" that differed by 6–8 percentage points because one excluded canceled orders and the other didn't. Neither definition was wrong. Neither team knew about the other's filter. Decisions kept getting deferred a week for "data cleanup," and a couple of staffing calls ended up being made off the wrong number.
They didn't buy anything fancy. They built a lightweight registry — a shared table with definitions, owners, and source fields — assigned one owner per metric, and added a handful of verification tests on the metrics that actually drove decisions. Thresholds got a one-line note explaining what crossing them was supposed to trigger.
Within about two months, the disputed-metric problem basically disappeared from reviews. Meetings shortened noticeably because the definition arguments stopped. More importantly, when a source pipeline broke a few weeks later, a freshness test flagged the affected metric as untrusted before the review — so nobody staffed against a stale number. The outcome wasn't a dramatic revenue jump. It was quieter than that: decisions stopped getting made off numbers nobody could actually stand behind.
When this makes sense — and when it doesn't
When it's worth building: You have multiple teams pulling overlapping concepts, metrics driving funding or staffing decisions, or automated triggers wired to thresholds. Any one of those three means the cost of a silently-wrong metric now exceeds the cost of governing it. Worth doing before you scale automation on top of metrics too — governing the inputs first prevents automating the mistakes.
When it's overkill: A team of three or four with one analyst and a handful of metrics everyone understands. Adding a formal registry and verification suite here is process for its own sake. Keep the definitions written down somewhere, keep them current, and revisit when you start hitting multi-team collisions.
Who should wait on this: Teams where no single decision is actually driven by a metric. If your metrics are informational and nothing automated or financial hangs on them, get your measurement-first rollout practice solid before layering governance on top. Governance without decisions attached to metrics is just paperwork.
Start where the decisions are, not where the dashboards are
The instinct when you first tackle this is to inventory every metric on every dashboard and govern all of them. That's the way to stall the whole effort before it starts. Most metrics on most dashboards drive nothing — they're there because someone once asked, and nobody deleted them.
Work backward from decisions instead. List the recurring decisions your team actually makes off metrics — funding gates, staffing changes, rollback triggers, prioritization calls. Then trace each one to the specific metrics that feed it. Those are the metrics that need owners, verification tests, and audit trails first. Everything else can wait, or quietly get retired.
Prioritize governance for metrics that feed recurring funding, staffing, or rollback decisions to get the most impact for the least effort.
This is the same logic behind connecting flow metrics directly to action — a metric that doesn't change a decision doesn't need governance, it needs deleting. Governance effort should be proportional to decision weight, not to how many charts happen to be on the wall.
The real payoff
Instrumentation governance isn't about cleaner dashboards. It's about being able to answer, at any moment, three questions: Is this number right? Who's accountable for it? And what decision did it drive?
Teams that get this right don't have more metrics — they usually have fewer, but every one of them is owned, tested, and traceable back to a real decision. That's the difference between a dashboard that decorates a meeting and one that actually moves money and people. The plumbing is unglamorous. The trust it produces is what lets your metrics carry the weight you've been pretending they already carry.
The plumbing is unglamorous. The trust it produces is what lets your metrics carry the weight you've been pretending they already carry.
Ready to boost your team's productivity?
Join 5,000+ teams using Workyly to streamline workflows, improve communication, and deliver projects faster.