

Most teams tracking flow metrics are measuring the wrong things, confidently. They've got a dashboard full of velocity charts and burndowns, everyone nods at standup, and then a project slips three weeks and nobody saw it coming until the client called. The dashboard was green the whole time.
That gap — between what you're measuring and what actually predicts whether work ships — is worth fixing. It's especially messy for non-engineering teams (marketing, ops, legal, creative, RevOps, customer success) because most flow measurement advice was written for software teams with tidy Jira workflows and story points. Those teams have their own problems, but at least their tooling assumes a "ticket" moves through defined states. A brand team shipping a campaign, or an ops team processing vendor onboarding, rarely has that structure built in.
So: which flow metrics genuinely predict delivery, how do you instrument them without engineering support, and — the part everyone skips — what specific action is a metric supposed to trigger when it goes sideways?
The core problem: teams measure activity, not flow
This pattern shows up almost everywhere. A team gets asked to "be more data-driven," so they start counting things. Tasks completed. Hours logged. Tickets closed per week. These feel like progress metrics, but they're activity metrics, and activity has almost no predictive relationship to delivery.
-
How long does work actually take from "we committed" to "it's done"?
-
How much unfinished work are we carrying at any moment?
-
Is work moving, or is it sitting?
Everything useful comes from those three. Notice none of them are "how busy is everyone."
The four metrics that actually predict delivery
After stripping away the vanity numbers, you're left with a small set that carries real predictive weight. These translate cleanly to non-engineering work if you're willing to define what a "unit of work" means for your team — a campaign, a hire, a contract review, an onboarding. Pick something.
Stop losing track of your priorities.
Workyly helps you organize, assign, and track every task efficiently.
- Centralized task management
- Real-time collaboration
- Intelligent workflow automation
No credit card required
| Metric | What it measures | Why it predicts delivery | Common misread |
|---|---|---|---|
| Cycle time | Time from work starting to finishing | Long or widening cycle time = late delivery, almost always | Confusing it with lead time (which includes waiting in the backlog) |
| Work in progress (WIP) | How many items are actively open right now | High WIP directly inflates cycle time; it's the leading indicator | Thinking high WIP means high productivity |
| Flow efficiency | % of cycle time spent actively worked vs. waiting | Reveals whether your delay is capacity or coordination | Assuming slow delivery means "we need more people" |
| Aging WIP | How long each in-progress item has been open | Catches specific at-risk items before they blow the deadline | Only looking at averages, which hide the outliers |
The one most non-engineering teams have never measured — and the one worth instrumenting first — is flow efficiency. Cycle time tells you work is slow. Flow efficiency tells you why. For teams outside engineering, the "why" is almost always waiting, not working.
A typical example: a creative team's design cycle time on a landing page is nine business days. Feels slow, so the instinct is "we need another designer." But when you break it down, actual design work is maybe 11 hours. The other seven-plus days are the asset sitting in a queue waiting for copy, waiting for legal sign-off, waiting for a stakeholder to reply to a Slack message. Flow efficiency there is under 20%. Hiring a designer does nothing. The problem is handoffs and approvals, and no amount of extra capacity fixes a waiting problem.
That's the reframe that matters: for non-engineering teams, most delivery risk lives in the waiting, not the working. Which means the metrics have to make waiting visible, or they're not much use.
Instrumenting these without a data team
You don't need engineers or a BI tool to get started. You need your work items to have honest timestamps for state changes. That's the whole trick, and it's also where most teams quietly fail.
-
Define your states. Keep it to four or five max. Something like: Not Started → Active → Waiting/Blocked → Review → Done. The critical one is a distinct Waiting state — most boards collapse this into "In Progress," which is exactly why flow efficiency stays invisible. If you never separate "being worked on" from "sitting in someone else's court," you can't diagnose anything.
-
Timestamp every transition. Whatever tool you use — Asana, ClickUp, Monday, Trello, a spreadsheet if you must — you need to know when each item entered and left each state. Most tools log this automatically once you actually move cards instead of leaving them parked.
-
Enforce the discipline of moving cards. This is the human part, and it's harder than the tooling. If people finish work but don't move the card, or start work without pulling it into Active, your data is garbage. Instrumentation is only as good as the moment-to-moment honesty of the board.
-
Calculate cycle time and flow efficiency weekly. Cycle time = (Done timestamp − Active-start timestamp). Flow efficiency = active time ÷ total cycle time. A pivot table handles it.
-
Chart aging WIP daily, not weekly. This is the early-warning system. Every open item gets an age. Anything past your threshold gets flagged. This is the one worth checking every morning.
The failure mode worth naming: teams instrument the tool but never fix the behavior. They add a Waiting column and then nobody uses it, so everything looks actively worked when half of it is stalled. Instrumentation is a behavior change disguised as a configuration change.
Threshold playbooks: turning a number into an action
A metric that doesn't trigger a specific action is just decoration. This is where almost every "data-driven" team falls apart — they have the numbers but no agreed-upon response, so a bad number generates a conversation instead of a correction.
Cycle time thresholds
-
Baseline established (e.g., median 6 days for your work type).
-
Yellow an item hits 1.5× median → the owner posts a one-line status and expected finish date.
-
Red an item hits 2× median → it goes on the blocker list and gets a named person responsible for unblocking it, not just the person doing the work.
WIP thresholds
-
Set a per-person and per-team WIP cap based on actual throughput, not a guess.
-
Trigger when team WIP exceeds the cap, the rule is stop starting, start finishing. No new work pulled in until something crosses to Done. This one rule fixes more delivery problems than any hiring plan.
Flow efficiency thresholds
-
Below roughly 40% for a given work type → you have a coordination problem, not a capacity problem. The action is to audit handoffs and approval gates, not add headcount.
Aging WIP thresholds
-
Any item older than your 85th-percentile historical cycle time gets escalated automatically. It's statistically already an outlier; treat it like one.
The important design principle here: thresholds should trigger actions, not alerts. An alert that says "cycle time is high" gets ignored by week three. A threshold that says "this item now has a named unblock owner and a 24-hour check-in" actually moves work.
The monitoring rhythm that ties metrics to corrective action
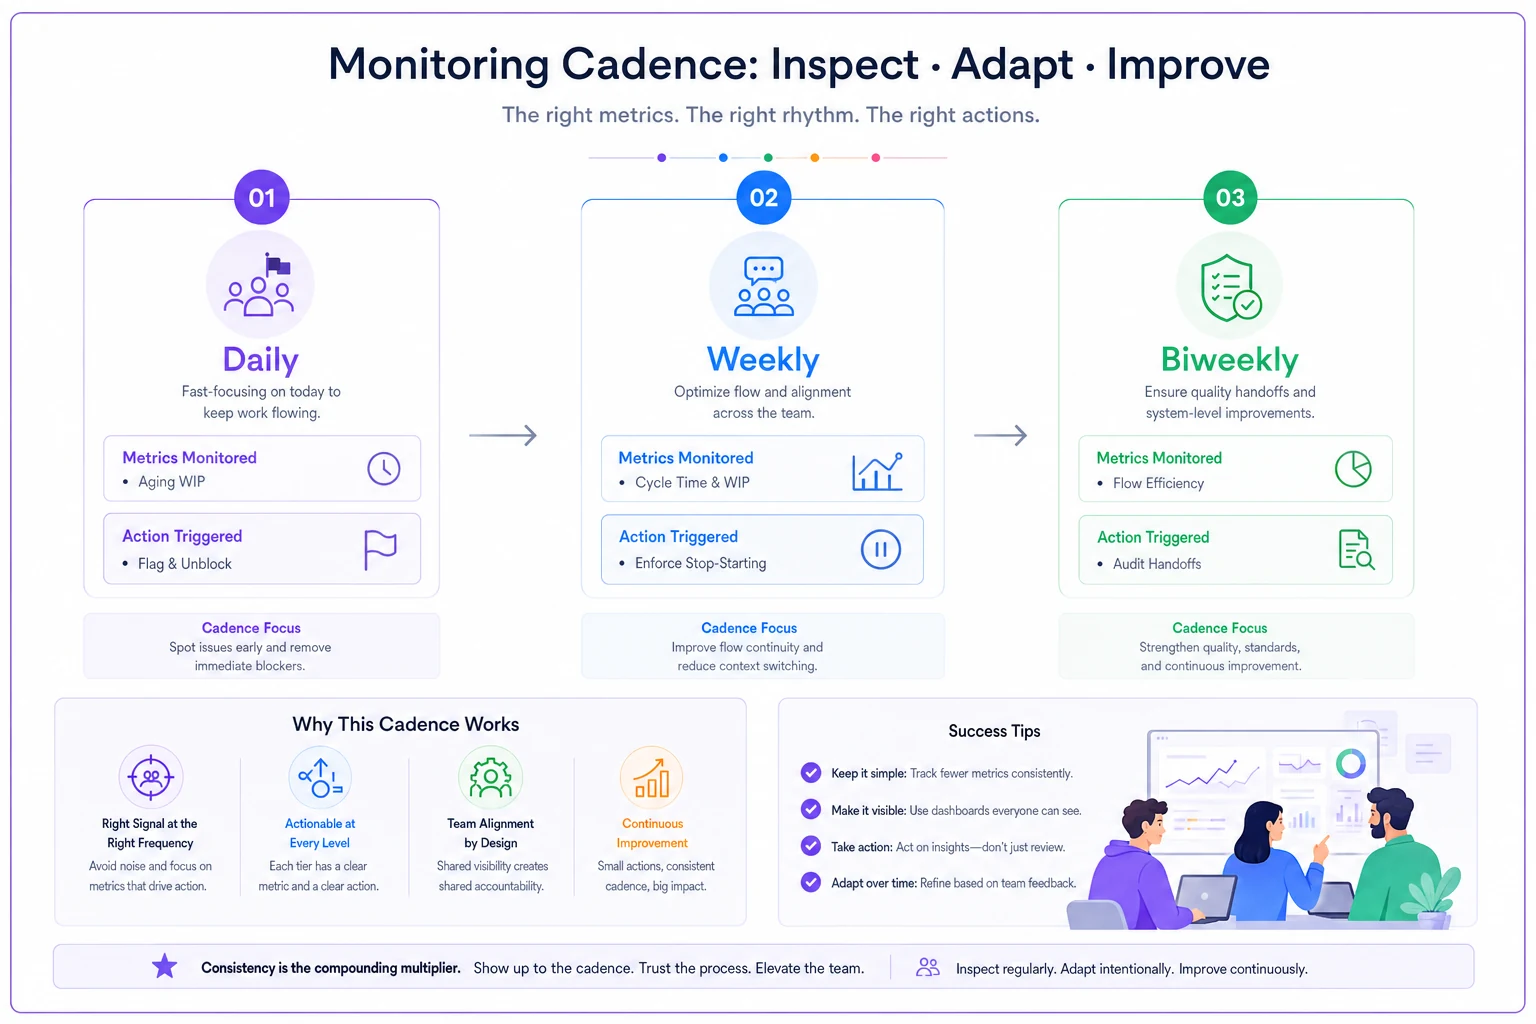
Metrics decay without a rhythm. You need a cadence, and it should be layered — different metrics warrant different frequencies. Checking everything weekly means you catch aging items too late. Checking everything daily means people tune it out.
[GRAPH: Daily → Weekly → Biweekly monitoring cadence showing which metrics belong to each tier and the action triggered at each level]
-
Daily (5 minutes) Aging WIP only. Scan the board for anything past threshold. Each flagged item gets one of three responses — unblock it, reassign it, or explicitly park it. No discussion of anything moving normally.
-
Weekly (20–30 minutes) Cycle time trend and WIP levels. Are we starting more than we finish? Is cycle time creeping up? This is where you enforce the stop-starting rule.
-
Biweekly or monthly Flow efficiency by work type. This is the slow-moving structural metric. If efficiency is dropping, you're accumulating coordination debt — usually new approval steps or a dependency that crept in quietly.
The mistake worth calling out: teams run a solid weekly metrics review and take zero corrective action. They observe the trend, say "yeah that's not great," and move on. Every review should end with named owners and specific items, or it's just a more expensive dashboard.
A real scenario
A mid-size RevOps team — roughly seven people handling deal desk, quoting, and contract routing — was consistently late on quote turnaround, and sales was frustrated. Their existing metric was "quotes completed per week," which looked fine at somewhere around 55–60 a week, steady.
When they instrumented cycle time and split out a Waiting state, the picture changed completely. Median cycle time on a quote was around 3.5 days, but active work was under 90 minutes. Flow efficiency was somewhere in the 15% range. Almost the entire delay was quotes sitting idle waiting for a manager who batched approvals once a day.
Nobody needed to work faster. They changed one thing: standard quotes under a certain threshold no longer needed manager approval at all, and anything above it got a same-morning review window. Within about six weeks, median cycle time dropped to under a day and flow efficiency climbed past 45%. Same team, same headcount, dramatically faster delivery — because the metric pointed at the actual bottleneck instead of at how busy everyone appeared.
The lesson isn't the specific fix. It's that the right metric made an invisible problem obvious, and a pre-agreed action turned it into a change rather than a discussion.
When this makes sense — and when it doesn't
When it's worth the effort:
-
Your work has a repeatable shape (even loosely) — onboardings, campaigns, reviews, tickets.
-
Delivery predictability actually matters to someone downstream.
-
You have enough volume that patterns emerge — more than 15–20 items a month.
When it's a bad idea:
-
Your work is genuinely one-off and unrepeatable. Instrumenting flow on truly bespoke projects produces noise, not signal.
-
The team is under five people and everyone already knows what's stuck. You'd be adding overhead to solve a problem you can see with your eyes.
-
Leadership wants the metrics to rank individuals. The second flow metrics become a performance-management tool, people game them — they'll close cards early, avoid pulling hard work, and your data dies. Flow metrics are for the system, not for scoring people.
Who should not do this yet: any team that hasn't agreed on what "done" means for a unit of work. If done is ambiguous, every metric downstream is ambiguous too. Fix the definition before you instrument the flow.
What changes as you scale
At a small scale, flow problems are visible and one person can hold the whole picture in their head. As a team grows past that point, the metrics stop being a nice-to-have and become the only reliable way to see coordination breaking down.
The pattern is predictable: the first thing that degrades at scale is flow efficiency, because every new person, team, and approval gate adds a handoff, and handoffs add waiting. A team of five might run at 50% flow efficiency without much effort. The same work distributed across four teams of five routinely drops into the teens purely from coordination overhead — not because anyone got slower, but because the work spends more of its life in transit between people. That's why aging WIP and flow efficiency matter most as you grow, while raw output numbers become increasingly meaningless.
Teams that stay predictable as they scale treat every new approval step, every new dependency, every "just loop me in" as a measurable tax on flow. The number tells them when their coordination has outgrown their process, usually months before a missed deadline would have.
Closing thought
Flow metrics don't predict delivery because they're clever. They predict delivery because they force you to look at where work actually sits instead of how busy everyone appears. Cycle time, WIP, flow efficiency, and aging WIP work for non-engineering teams for the same reason they work for engineering ones — work is work, and waiting is waiting, regardless of what's inside the ticket.
The instrumentation is honestly the easy part. The hard part is committing to honest state transitions, pre-deciding thresholds, and actually taking action when the numbers drift instead of just admiring the chart. Get those three things right and you'll see slips coming weeks earlier — which is really the only thing a flow metric is for.
Ready to boost your team's productivity?
Join 5,000+ teams using Workyly to streamline workflows, improve communication, and deliver projects faster.