

Most teams approach change management backwards. They roll out the new process, watch chaos unfold for three weeks, then scramble to figure out whether things are actually worse or if people just hate change. By that point, you've lost momentum, trust, and probably a few good employees who decided they'd rather work somewhere with fewer "process improvements."
The smarter approach starts with measurement infrastructure before anyone changes anything. You instrument first, baseline your current state, then roll out changes with clear signals for success or failure. Actual data instead of loudest-voice-wins feedback sessions.
Why traditional change rollouts become organizational trauma
Change fails when teams treat it like flipping a switch. Monday you work one way, Tuesday everything's different, and by Friday nobody knows what they're supposed to be doing. The damage compounds when leaders can't tell if the resistance is coming from legitimate problems or just normal adjustment friction.
A 45-person engineering team tried to adopt a new ticketing system with no baseline metrics, no phased approach — just "everyone switches on April 1st." Three weeks later, velocity had crashed around 40%, standups were stretching to 90 minutes, and the VP was asking whether to scrap the whole thing. The real problem? Nobody could tell if the tool was failing or if they just needed two more weeks of muscle memory to kick in.
That measurement gap creates decision paralysis. Without data showing whether you're trending toward success or quietly spiraling, leaders either pull the plug too early (wasting months of prep) or stick with a failing change long enough to burn out the team.
Building your pre-change instrumentation layer
Before touching any process, you need three categories of baseline metrics running for at least two weeks. This gives you the "before" picture that makes your "after" data actually mean something.
Stop losing track of your priorities.
Workyly helps you organize, assign, and track every task efficiently.
- Centralized task management
- Real-time collaboration
- Intelligent workflow automation
No credit card required
Workflow metrics track how work moves through your system. Measure cycle time from ticket creation to completion, handoff delays between teams, and WIP levels at each stage. If you're changing how teams collaborate, you need to know your current collaboration overhead — time in meetings, response times on async requests, rework from miscommunication.
Team health indicators capture the human side. Track overtime hours, context switching (how many different projects someone touches per day), and engagement proxies like PR review times or documentation contributions. These tell you if your team actually has capacity for change or if they're already running on fumes.
Output quality markers measure what gets delivered. Bug rates, customer complaints per release, feature completion percentages — these give you the business impact baseline. A new process that speeds up delivery but doubles your bug rate isn't an improvement.
Automate dashboard data pulls and alerts so you don't rely on manual tracking during a rollout.
Set up dashboards that pull this data automatically. Manual tracking won't survive rollout chaos. Most teams can instrument basic metrics using existing tools — Jira's built-in reports, GitHub's API, or even automated spreadsheet pulls from their time tracking system.
The three baseline categories map to each other in a specific sequence. Understanding that flow matters when you're trying to diagnose which layer is causing problems during a rollout:
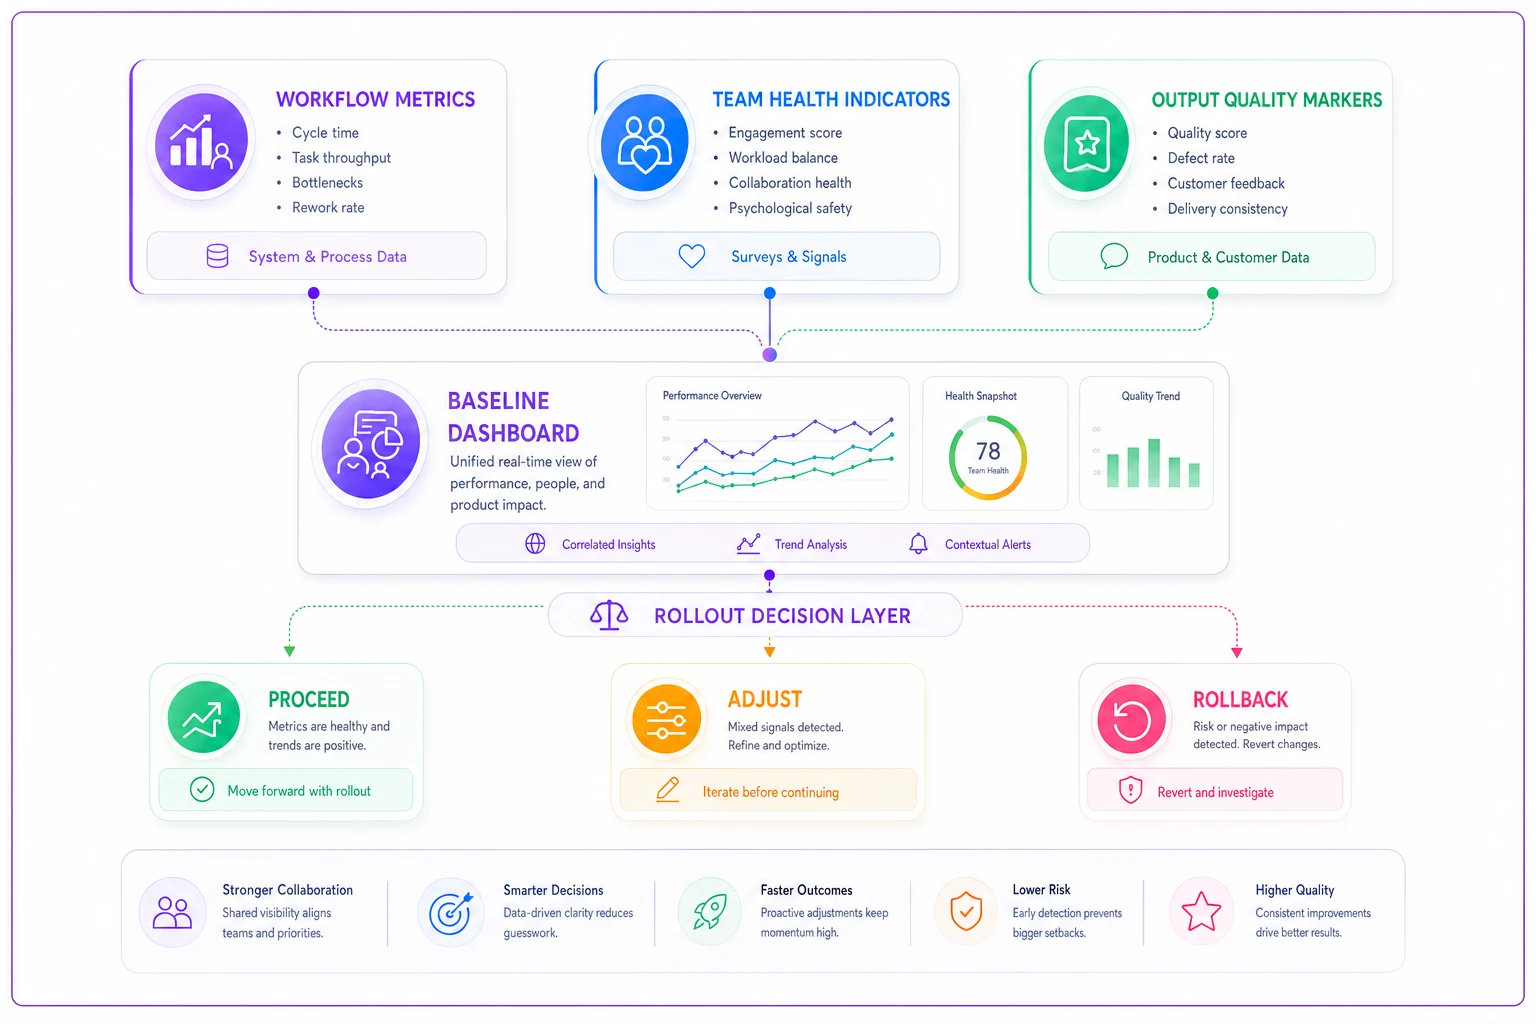
A quick visualization of that flow helps teams see where issues originate and how they cascade.
Running all three in parallel before your rollout starts means you catch cross-layer issues early — like a workflow change that looks clean on paper but quietly increases overtime before it ever shows up in output quality.
Designing adoption KPIs that actually predict success
Generic metrics like "percentage of team trained" tell you nothing about whether the change will stick. Real adoption KPIs measure behavior change and outcome improvement, not attendance at training sessions.
Start with behavior-based thresholds. If you're implementing a new code review process, track the percentage of PRs following the new format. Set graduated targets: 30% adoption by week one, 60% by week two, 85% by week four. Miss those marks and you know something's structurally wrong, not just slow.
Layer in quality gates that prevent gaming. That same code review process should also track review depth — comments per PR — not just compliance. Otherwise you get checkbox reviews that follow the process but miss the point entirely.
Create paired metrics that balance speed and quality. If you're rolling out new project planning methods, track both planning time reduction AND project predictability. A 50% faster planning process that produces unreliable timelines isn't a win.
Your adoption KPIs should trigger automatic alerts when they drop below thresholds.
| KPI Type | Example Metric | Week 1 Target | Week 2 Target | Week 4 Target |
|---|---|---|---|---|
| Behavior-based | PRs following new format | 30% | 60% | 85% |
| Quality gate | Comments per PR | Baseline +10% | Baseline +20% | Baseline +30% |
| Speed/quality pair | Planning time reduction | 10% | 25% | 50% |
| Health indicator | Overtime change | 0% increase | 0% increase | Decrease |
Week two adoption at 15% when you expected 30%? That's an emergency team meeting, not a "let's see how week three goes" situation.
The power of 2-week experiment cycles
Full transformations fail because they're too big to course-correct midway. Frame every change as a series of 2-week experiments with explicit hypotheses and success criteria.
Each experiment should change exactly one thing. Week one might test the new standup format with just the backend team. Week two adds the frontend team. Week three adjusts the format based on what broke. This incremental approach lets you isolate what works from what doesn't instead of guessing after the fact.
Document the hypothesis upfront: "Switching from daily standups to async check-ins will reduce meeting time by 3 hours per week while maintaining or improving blocker resolution time." Now you have something measurable — not just "let's try async and see what happens."
Build forced reflection points into each cycle. Every second Thursday, review the data with the team. Show them the numbers, gather qualitative feedback, and make the keep/kill/modify decision together. Skeptics turn into partners pretty quickly when they're part of the process.
The experiment mindset also reduces resistance. People will try almost anything for two weeks. Tell them it's permanent and they'll spend those same two weeks building a case for why it won't work. When meetings become the primary blocker to progress, small experiments help teams discover better alternatives without the fear of permanent change.
Rollback triggers and the governance structure
Clear rollback triggers remove emotion from failure decisions. Define these before you start, when everyone's still optimistic.
Productivity triggers fire when core metrics fall below critical thresholds. Cycle time up more than 25% after week two — automatic rollback. Bug rates above 1.5x baseline for two consecutive sprints — automatic rollback. No debates, no "but we just need more time." The numbers make the call.
Team health triggers protect your people. If overtime increases more than 4 hours per week on average, or more than 30% of the team reports feeling overwhelmed in weekly pulse surveys, you rollback. Pushing through team burnout for a process change is like burning furniture to heat your house — short-term warmth, long-term disaster.
Cascade triggers catch secondary effects. Sometimes a process works fine in isolation but breaks downstream. If customer support ticket volume increases 40% because of confusion from your new release process, that's a rollback trigger even if engineering metrics look fine.
Assign clear governance roles before you start. The experiment owner monitors metrics daily and can trigger emergency rollbacks. The sponsor — usually a director or VP — makes the final keep/kill decision at cycle end. The ops team maintains the measurement infrastructure and provides neutral data reports. Separating these roles prevents cherry-picking metrics to support outcomes people already decided on.
-
Productivity triggers — review within 24 hours of threshold breach, decision within 48 hours
-
Team health triggers — immediate notification to experiment owner, team check-in within 24 hours
-
Cascade triggers — cross-functional review required before rollback decision, typically 48–72 hours
Speed matters here. The longer you wait after a trigger fires, the harder the rollback becomes.
The instrumentation reality check
Measurement infrastructure reveals uncomfortable things about your operation. Most teams discover their baseline performance is worse than they thought. That "occasional delay" in code reviews averages 3.5 days. The "quick sync" meetings eat 14 hours per week. The "mostly smooth" deployment process fails nearly a third of the time.
This reality check actually helps change adoption. When people see the true cost of current processes, they're more willing to experiment with alternatives. The data shifts the conversation from "why change?" to "why haven't we changed already?"
But watch out for measurement theater — tracking everything but acting on nothing. I've seen teams build gorgeous dashboards with 40+ metrics and then ignore all of them when making actual decisions. If you're not willing to act on the data, don't waste time collecting it.
Making the gradual rollout actually gradual
Phased rollouts usually aren't phased enough. Teams do "Phase 1: Development team" then "Phase 2: Everyone else" — which is like testing a parachute by jumping from a chair, then immediately jumping from a plane.
Real phasing happens at the sub-team level. Start with your most change-friendly squad — usually the one that's been loudest about problems with the current process. They become your beta testers and internal evangelists. Their success stories, backed by actual data, carry more weight with skeptics than any top-down mandate.
Next, add your highest-performing team. They'll stress-test whether the process holds under pressure. If it breaks with your best team, it'll definitely break everywhere else. Similar to setting WIP limits, what works for one team often needs adjustment for another.
Then expand to teams with dependencies on the early adopters. This surfaces integration issues while you still have a small enough group to coordinate fixes. The final phase brings in the remaining teams, who now have multiple real examples of success and a process refined by actual feedback.
Each phase needs its own success criteria. Phase 1 might just aim for "no productivity loss." Phase 2 targets "10% improvement in cycle time." By the final phase, you're shooting for the full transformation goals.
Balancing automation with human judgment
AI-powered operational software can meaningfully accelerate your measurement and rollout process, but it shouldn't replace human judgment about when to proceed or rollback. The tools are good at data collection, pattern recognition, and alert generation. They're less reliable at the "this feels wrong even though the numbers look okay" situations that experienced managers pick up on.
Use automation to maintain consistent instrumentation across all teams and phases. Let it track your metrics, calculate trends, and flag anomalies. That frees people to focus on interpretation and decision-making rather than spreadsheet management.
Automated alerts should prompt human investigation, not automatic action. When cycle time spikes 30%, the system should immediately notify the experiment owner, who then determines if it's a one-day anomaly or a systemic issue. Human-in-the-loop prevents both alert fatigue and missed problems.
The most useful automation shows change impact across connected systems. When you adjust the code review process, a good platform can surface the ripple effects on deployment frequency, bug rates, and team morale scores. These multi-dimensional views catch problems that single metrics will always miss.
When rollback becomes roll forward
Sometimes the data says "rollback" but the team says "we're close." This tends to happen around week three of a difficult change, when the pain is maximum but the benefits haven't shown up yet.
Create a "controlled burn" provision for these situations. If core metrics are bad but clearly trending better, and the team genuinely believes they're near the turning point, extend one more cycle with tighter monitoring. But this only works once. If the next checkpoint still shows red, you rollback — no debate.
Document everything during extension periods. What indicators made the team think success was near? What adjustments did they make? That information becomes invaluable for the next attempt, turning failure into education rather than just time lost.
A rollback doesn't mean permanent abandonment. It means returning to stability, understanding what went wrong, and trying again with better preparation. Most successful transformations take two or three attempts, each one shaped by what the previous failure actually showed in the data.
Change management stops being a guessing game when you treat it like any other operational process — instrument it, measure it, and adjust based on what you find. The teams that successfully transform their operations aren't the ones with the best ideas or the strongest willpower. They're the ones that know exactly what's happening at each stage and can make clear-headed decisions about whether to proceed, adjust, or stop.
The measurement-first approach turns resistance into curiosity. Instead of "this new process sucks," you get "the data shows review time increased by 2 hours — what's causing that?" Instead of indefinite suffering through a bad change, you have clear endpoints and rollback triggers that protect the team while still pushing toward improvement.
And honestly, it builds trust in the change process itself. When teams know there are objective success criteria and safety rails, they're more willing to try bold changes. The fear of being stuck with a bad process disappears when everyone knows the experiment has an expiration date and the data — not politics or pride — drives the final decision.
Ready to boost your team's productivity?
Join 5,000+ teams using Workyly to streamline workflows, improve communication, and deliver projects faster.