
Your engineering team commits to three major features this sprint. Marketing needs a critical campaign update by Thursday. Support is drowning in tickets. Then your lead developer gets pulled into an urgent production issue that eats two full days.
Sound familiar? This isn't a people problem or a motivation issue. It's a capacity planning problem that most organizations completely misunderstand.
The mistake everyone makes: treating team capacity like a simple headcount calculation. Eight developers times 40 hours equals 320 hours of work capacity, right? Dead wrong. That thinking leads to chronic overcommitment, missed deadlines, and burnt-out teams.
What actually works is counterintuitive — planning for less capacity than you have. Not because your team is lazy or inefficient, but because real work doesn't happen in neat, predictable blocks.
Why traditional capacity models fail in real operations
Most capacity planning approaches fail because they ignore three fundamental realities of how work actually happens.
First, there's the interruption tax. Your senior engineer doesn't actually have eight hours of coding time per day. Between code reviews, helping junior developers, architecture discussions, and that one critical bug that only they can fix, their actual productive coding time might be four to five hours on a good day.
Second, unplanned work always shows up. Customer emergencies, production issues, urgent executive requests — these aren't exceptions, they're the norm. Yet most capacity models pretend they don't exist until they blow up your carefully planned sprint.
Third, context switching destroys productivity in ways that simple time tracking can't capture. When someone jumps between three different projects in a day, you don't just lose the switching time. You lose the deep focus time where real problem-solving happens.
A product team tracked their actual capacity for a month and discovered their "100% capacity" was really closer to 65% when you factored in meetings, interruptions, and context switching. No wonder they kept missing deadlines — they were planning based on fantasy numbers.
The buffer band model: a realistic approach to capacity
Instead of pretending you can predict exactly how much work your team can handle, the buffer band model acknowledges uncertainty upfront. Here's how it breaks down:
Stop losing track of your priorities.
Workyly helps you organize, assign, and track every task efficiently.
- Centralized task management
- Real-time collaboration
- Intelligent workflow automation
No credit card required
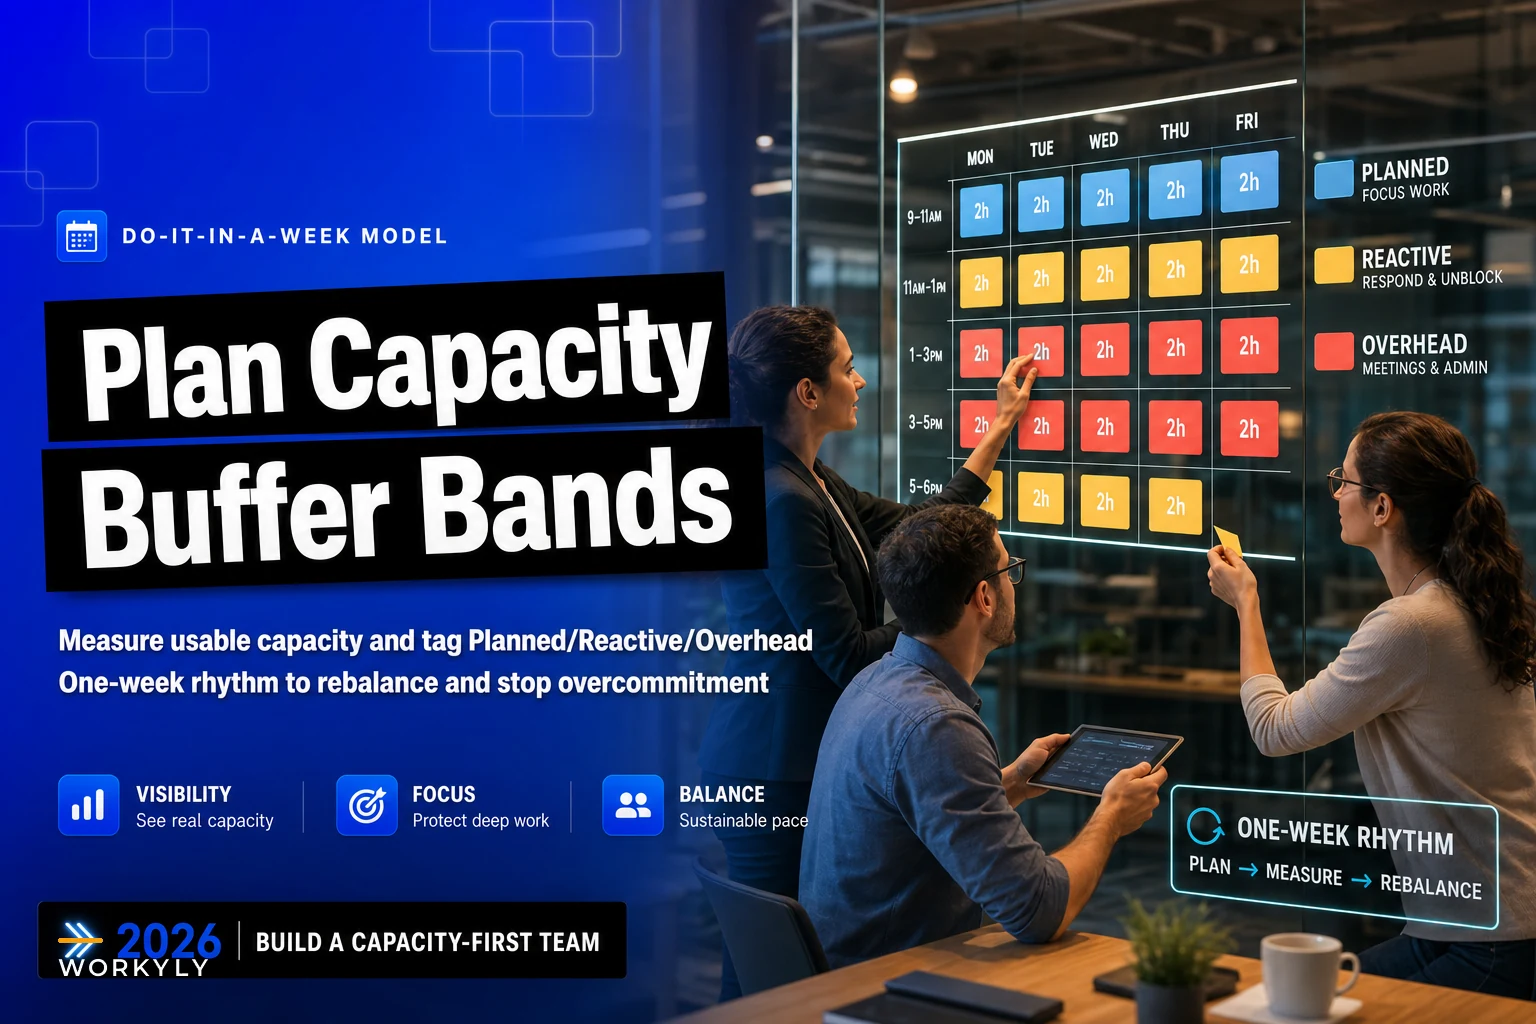
Core capacity (40-50%): Your planned, committed work. Features, projects, deliverables with deadlines. Keep this intentionally low. Reactive buffer (25-30%): Reserved for the unplanned but inevitable — bug fixes, urgent requests, production issues. This isn't slack time; it's realistic planning. Maintenance band (15-20%): Technical debt, code reviews, documentation, team meetings. The work that keeps your systems healthy but often gets squeezed out when things get busy. Innovation buffer (10-15%): Experimentation, learning, process improvements. Small now, but critical for long-term team health.
These aren't arbitrary percentages. They reflect patterns across many development teams. A mobile app team might need a larger reactive buffer during app store review periods. A B2B SaaS team might need more maintenance band for enterprise customer support.
The key insight: these buffers aren't waste. They're what makes your commitments actually achievable.
Week one: measuring your team's real capacity
Monday morning, start with a simple tracking exercise. Don't overthink it — complexity kills adoption.
-
Planned work (what was scheduled)
-
Reactive work (what interrupted)
-
Overhead (meetings, reviews, coordination)
Each team member tracks in 2-hour blocks. Not detailed time sheets — just rough categories. "Morning: planned feature work. Afternoon: emergency customer issue." That level of detail is enough.
Keep entries coarse — 2-hour blocks are sufficient for spotting patterns without creating overhead.
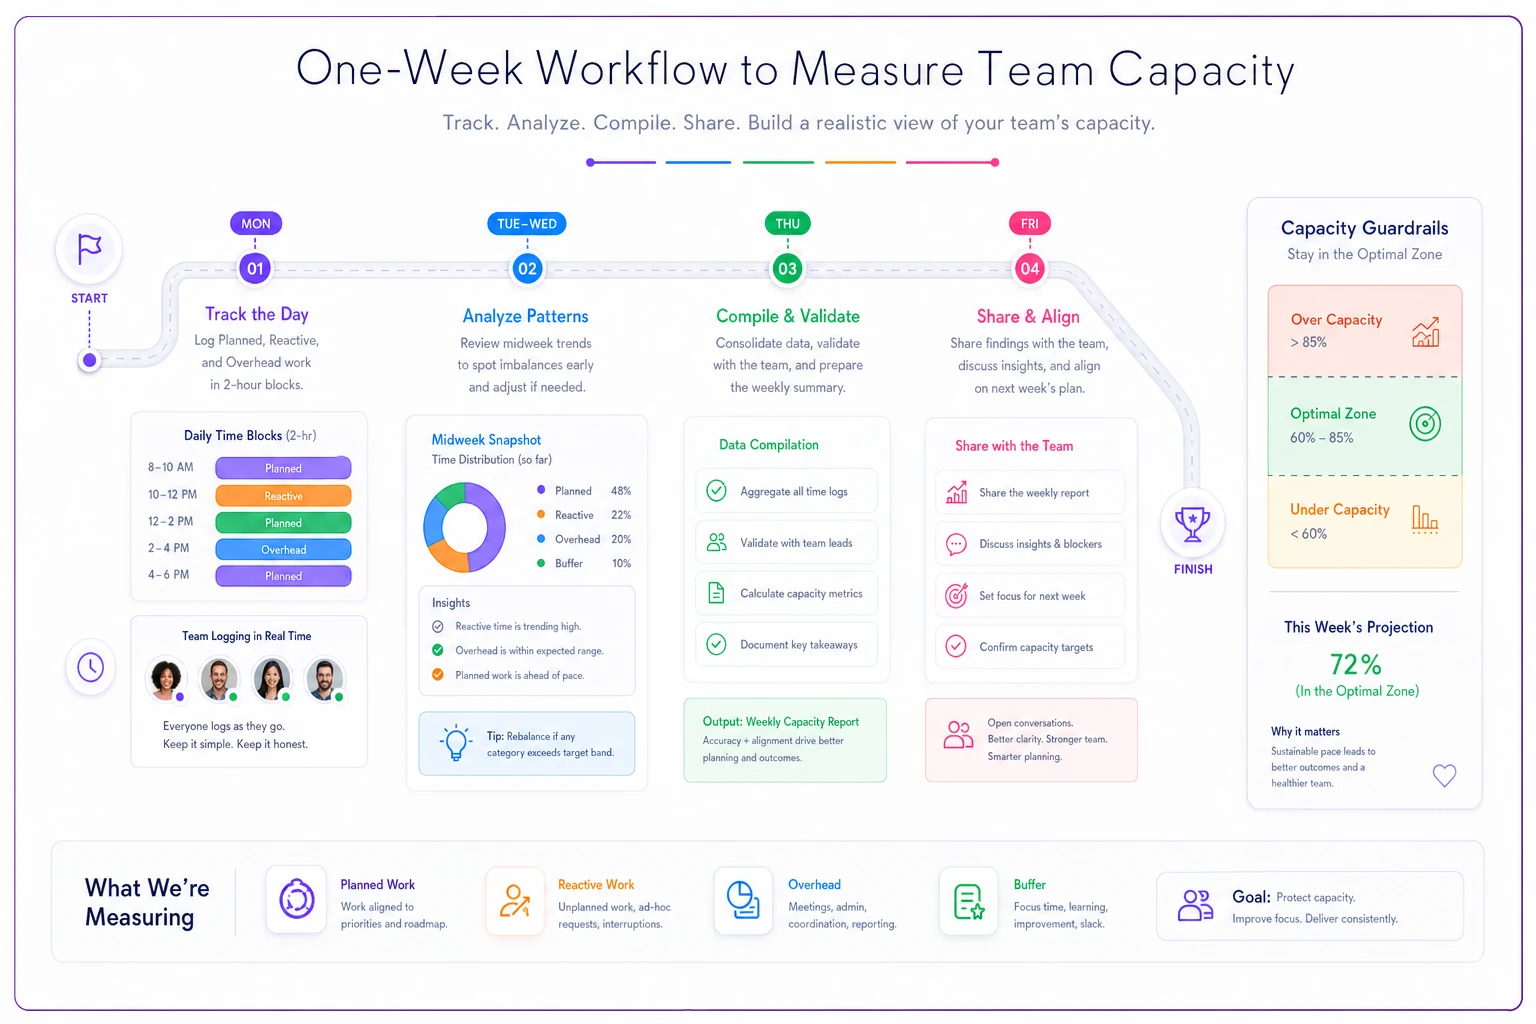
By Wednesday, patterns emerge. Senior developers are spending 30-40% of their time on unplanned work. Junior developers have more planned work time but need more overhead for learning and reviews. Your tech lead barely touches code because they're constantly pulled into meetings.
Thursday, you compile the data. Not to judge or optimize yet — just to see reality. Most teams discover they have about 60-70% of the capacity they thought they had. Some find it's even lower.
Friday, share the findings with the team. No blame, no "we need to be more efficient" speeches. Just acknowledgment of reality. This baseline becomes your starting point for realistic planning.
Defining your buffer bands based on team patterns
Once you know your actual capacity, you can set realistic buffer bands. But these aren't one-size-fits-all percentages — they need to reflect your team's specific reality.
Start with your baseline data from week one. If unplanned work ate 35% of your time last week, your reactive buffer needs to be at least 30%. Better to overestimate initially and adjust down than to underestimate and fail immediately.
| Team Type | Core Capacity | Reactive Buffer | Maintenance | Innovation |
|---|---|---|---|---|
| Feature Team | 45-50% | 25-30% | 15-20% | 10% |
| Platform Team | 35-40% | 35-40% | 20-25% | 5% |
| Customer-Facing Team | 40-45% | 30-35% | 20% | 5-10% |
| R&D Team | 50-55% | 15-20% | 15% | 15-20% |
Your platform team handling infrastructure needs a massive reactive buffer because when things break, they drop everything. Your R&D team working on next-gen features can have smaller reactive buffers but needs more innovation time.
Don't just copy these numbers. Look at your week-one data and adjust accordingly. If your team handles both features and customer support, you might need a hybrid model with larger reactive buffers during certain hours or days.
The maintenance band often gets pushback. "20% for maintenance? That's a full day per week!" Yes, exactly. That's how you avoid the technical debt crisis that makes everything take three times longer six months from now.
Running the weekly rebalancing cadence
Static capacity plans fail because work is dynamic. The weekly rebalancing cadence keeps your capacity model accurate and responsive.
-
Review last week's actual vs. planned capacity usage
-
Identify this week's known commitments
-
Check buffer health — are they too full? Too empty?
-
Adjust allocations for this week only
This isn't a lengthy planning session. You're not replanning the entire quarter. You're making small, tactical adjustments based on current reality.
When your reactive buffer is consistently overflowing, you have two choices: increase it (reducing core capacity) or fix the root causes of interruptions. Often, teams find that better intake processes can reduce reactive work by 20-30%.
When your core capacity is consistently underutilized, resist the urge to immediately take on more work. First check if work is secretly happening in other bands. Sometimes "maintenance" work is actually feature work in disguise.
The rebalancing cadence also surfaces systemic issues. If every week requires major adjustments, your initial bands are probably wrong. If certain team members always max out their reactive buffer, they might be your unofficial escalation point for everything.
Common pitfalls when implementing buffer bands
The biggest failure mode: treating buffers as "free time" that can be claimed for urgent projects. The moment you start saying "we have 30% reactive buffer, so we can squeeze in this urgent feature," you've destroyed the entire model.
Buffers aren't unused capacity. They're capacity reserved for specific types of work. When you steal from the reactive buffer for planned work, you're betting that no emergencies will happen. That bet rarely pays off.
Another common mistake: setting uniform buffers across all team members. Your senior architect needs different buffer distributions than your junior developer. Your DevOps engineer who's on call needs different buffers than your UI designer. Team-level averages are fine for initial planning, but individual adjustments are what make the model actually work.
The "we're different" trap catches a lot of teams. "We're a startup, we can't afford 20% maintenance buffer." Or "we're enterprise, we need 50% reactive buffer for customer requests." Maybe you are different — but start with typical patterns and adjust based on data, not assumptions.
Some teams try to track at too granular a level. Fifteen-minute increments, twelve different categories, detailed task codes. This precision theater doesn't improve capacity planning; it just creates overhead that eats into actual capacity. Keep it simple enough that people will actually do it.
Capacity planning for teams in different contexts
A fintech startup with 8 engineers can't use the same capacity model as a 50-person enterprise team. Context matters.
Small teams need more flexible bands. When you only have two backend engineers, one person getting sick can blow up your entire capacity model. Instead of rigid percentages, use ranges: "Core capacity: 40-55% depending on availability."
Larger teams can be more precise but need to account for coordination overhead. A 30-person team doesn't have 30 times the capacity of a one-person team. Communication, alignment, and handoffs eat significant capacity. Some teams find that setting WIP limits helps manage this coordination overhead.
Cross-functional teams need special consideration. When your "team" includes developers, designers, QA, and product managers, capacity planning becomes multidimensional. A developer might have capacity, but if the designer is maxed out, that feature still can't ship.
Remote teams often need larger buffers for async communication delays. That quick clarification that takes 30 seconds in person might take a couple hours over Slack. Not worse, just different — but your capacity model needs to account for it.
Customer-facing teams live in a different reality. Their reactive buffer isn't just for emergencies; it's for customer calls, demos, and support escalations. One B2B team had to maintain a 45% reactive buffer just to cover customer success activities.
Making the model sustainable with operational software
Manual capacity tracking works for a week or two, then falls apart. People forget to update spreadsheets. Data gets stale. The weekly cadence turns into a monthly scramble to reconstruct what actually happened.
This is where operational software makes the difference between a nice idea and a sustainable practice. Not complex project management suites, but focused tools that make capacity planning actually manageable day-to-day.
The right platform pulls data from where work actually happens — your task tracker, calendar, incident system — instead of requiring manual entry. It shows buffer health in real-time, not just during weekly reviews. When reactive work starts overwhelming your buffers, you know immediately, not next Monday.
AI automation can also surface patterns humans tend to miss. Like how every third Thursday your reactive buffer explodes because that's when the monthly customer webinar happens and everyone has questions. Or how certain task types consistently run 40% over estimate, quietly throwing off your core capacity calculations.
Good operational software makes the weekly rebalancing cadence take 15 minutes instead of an hour. Pre-populated data, automatic calculations, clear visualizations of what needs attention. That's the difference between a process people actually follow and one they quietly abandon after three weeks.
When buffer bands won't solve your problems
Buffer bands aren't magic. They won't fix fundamental organizational dysfunction.
If your team is consistently running at 120% capacity with no slack, buffer bands just document the problem. You need headcount or scope reduction, not better planning.
If work comes from too many different sources with no real prioritization, buffers can't help. You're playing defense against chaos. Fix the intake process first.
If your organization punishes teams for having any unused capacity — "Why does your team have 20% maintenance buffer? Ship more features!" — that's a culture problem, not a planning problem. No model survives that environment.
Buffer bands work when leadership understands that sustainable pace beats heroic sprints. When protecting maintenance time is seen as professional, not lazy. When having capacity for emergencies is considered good planning, not waste.
The path to realistic capacity planning
After going through this with dozens of teams, the same realization hits everyone: we've been lying to ourselves about capacity for years.
Not maliciously. We just wanted to believe we could do more than was realistic. That if we planned better or found the right tool, we could sustain 120% capacity indefinitely.
Buffer bands aren't about doing less work. They're about making realistic commitments and actually meeting them. About having room for inevitable surprises without destroying your planned deliverables. About maintaining your systems and your team's sanity at the same time.
Start with one week of honest capacity measurement. Set initial buffer bands based on what you actually see, not what you wish were true. Run the weekly cadence to keep the model accurate. Use operational software to make it sustainable over time.
Most teams find that after a month of buffer-based capacity planning, they're delivering more consistently with less stress. Not because they magically gained capacity, but because they finally stopped pretending they had capacity that never existed.
The chronic overcommitment cycle — promise too much, scramble to deliver, burn out the team, repeat — doesn't have to be inevitable. It's a choice. Buffer bands give you a different choice.
Your team will thank you.
Your stakeholders might even thank you once they realize that "70% delivered reliably" beats "120% promised but 60% delivered" every time.
Ready to boost your team's productivity?
Join 5,000+ teams using Workyly to streamline workflows, improve communication, and deliver projects faster.